

지난 글에서 러너와 집계와 게이트를 짜서 배포 전에 품질을 재는 방법을 다뤘다. 그 장치는 우리가 준비한 데이터셋 위에서만 돈다. 배포 뒤에 들어오는 요청은 우리가 고른 것이 아니고, 거기서 무엇이 어긋나는지는 게이트가 알려 주지 않는다.
관측성(observability)은 시스템 밖으로 나온 신호만으로 안에서 무슨 일이 있었는지를 되짚을 수 있는 성질이다. 미리 정해 둔 대시보드 몇 장을 보는 것과는 다르다. 「어제 오후 3시쯤 결제 문의 답변이 이상했다」는 신고를 받았을 때 그 요청 한 건을 찾아 무엇이 들어갔고 어디서 몇 밀리초를 썼고 어떤 문서를 물어 왔는지를 사후에 재구성할 수 있느냐가 기준이다.
전통적인 웹 서비스라면 이게 크게 어렵지 않다. 요청 하나가 함수 몇 개를 지나 DB를 한두 번 치고 끝나므로, 응답 시간이 늘었다면 볼 곳도 두세 군데다. LLM 애플리케이션은 다르다. 사용자의 한 문장이 들어오면 질의를 다시 쓰고, 벡터를 만들고, 문서를 검색하고, 순위를 다시 매기고, 프롬프트를 조립해 모델을 부르고, 모델이 툴을 부르겠다고 하면 툴을 실행하고, 그 결과를 다시 넣어 또 부른다. 이 중 어디서 3초가 샜는지를 평균 응답 시간 그래프는 알려 주지 않는다.
평균 지연과 트레이스
지연의 분해
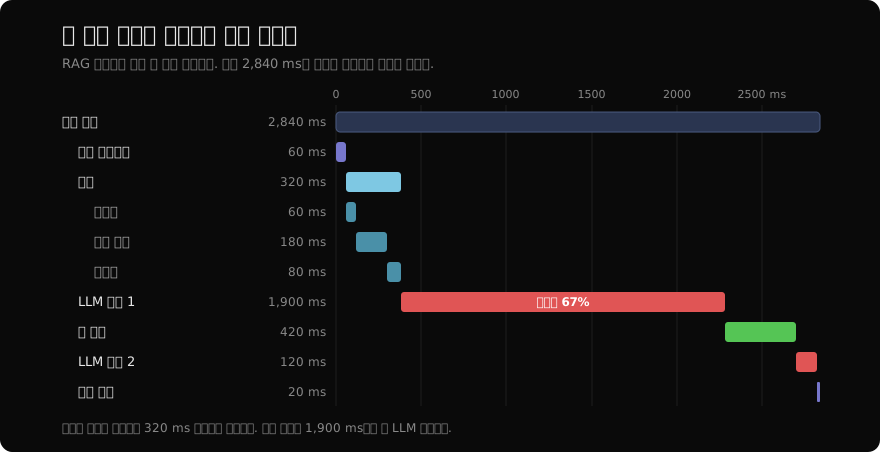
이 그림 한 장이 이 글 전체의 이유다. 요청 한 건이 2,840 ms를 썼고, 그 시간이 어느 조각에 얼마씩 잠겨 있는지가 가로 막대로 펼쳐져 있다.
평균 지연이 2.8초라는 것만 알면 팀은 대개 검색 파이프라인부터 만지기 시작한다. 조각이 많고 손댈 데가 많아 보이기 때문이다. 임베딩 모델을 바꿔 볼 수도 있고, 인덱스를 다시 세울 수도 있고, 리랭커를 떼어 볼 수도 있다. 리랭킹은 검색이 뽑아 온 후보들을 다른 모델로 다시 채점해 순서를 바로잡는 단계인데, 그것만으로도 하루가 간다.
그런데 그림을 보면 검색 전체가 320 ms다. 임베딩 60 ms, 벡터 검색 180 ms, 리랭크 80 ms를 합친 값이다. 여기서 절반을 줄이면 160 ms가 빠지고, 전체로는 5.6%가 빨라진다. 일주일을 써서 체감이 안 바뀐다는 뜻이다.
실제로 손댈 자리는 1,900 ms를 쓴 첫 LLM 호출이고, 이 하나가 전체의 67%다. 여기서 30%만 줄여도 570 ms가 빠져 전체가 20% 빨라진다. 그리고 그 30%를 얻는 방법은 검색과 전혀 다른 쪽에 있다 — 출력 길이를 제한하거나, 이 단계만 더 작은 모델로 보내거나, 스트리밍으로 첫 토큰을 먼저 흘려 체감을 바꾸는 것이다.
트레이싱이 없으면 이 판단을 감으로 한다. 그리고 감은 대개 복잡해 보이는 쪽을 고른다.
스팬과 트레이스
트레이싱(tracing)은 요청 하나가 시스템을 지나는 경로를 조각으로 쪼개, 조각마다 시작·끝 시각과 맥락을 함께 기록하는 방식이다. 그 조각 하나를 스팬(span)이라 부르고, 한 요청에 속한 스팬 전체를 트레이스(trace)라 부른다.
스팬은 부모·자식 관계를 갖는다. 「요청 전체」라는 스팬 아래에 「검색」이 있고, 그 아래에 「임베딩」과 「벡터 검색」이 있는 식이다. 위 그림에서 막대들이 계단처럼 들여쓰여 있는 것이 그 관계다. 이 계층 덕분에 시간이 어디에 잠겨 있는지가 층층이 보인다 — 검색이 320 ms라는 것과, 그 320 ms 안에서 벡터 검색이 180 ms를 쓴다는 것을 한 화면에서 읽는다.
여러 조각을 하나로 묶어 주는 것은 트레이스 ID다. 요청이 들어올 때 무작위 문자열을 하나 만들어 두고, 그 요청에서 열리는 모든 스팬이 그 값을 달고 다닌다. 나중에 저장소에서 그 ID로 모으면 요청 하나의 여정이 통째로 복원된다. 조금 뒤에 볼 「트레이스가 조각조각 나 있다」는 사고는 전부 이 값이 어딘가에서 전달되지 않은 결과다.
메트릭·트레이스·로그
이미 로그도 쌓고 대시보드도 있는데 왜 또 하나를 붙이냐는 질문이 자연스럽다. 셋은 겹치는 부분이 있지만 답하는 질문이 다르다.
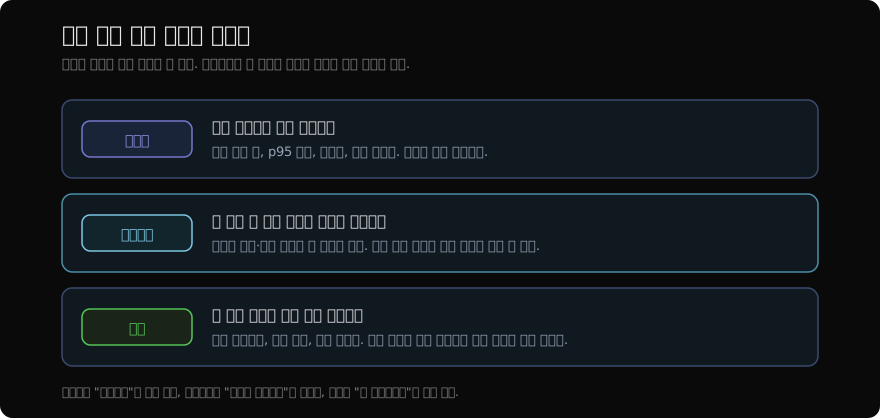
메트릭만 있으면 「어제보다 p95가 1.2초 늘었다」까지는 안다. p95는 요청을 응답 시간 순으로 줄 세웠을 때 95%가 그 아래에 들어오는 값이고, 평균과 달리 느린 쪽 꼬리를 보여 준다. 그래서 문제가 있다는 것은 알려 주지만, 거기서 더 못 간다. 어느 단계가 늘었는지, 특정 사용자만 그런지, 특정 프롬프트 버전에서만 그런지를 메트릭은 담고 있지 않다.
로그만 있으면 개별 요청의 값은 보이지만 요청 하나에 속한 줄들을 다시 이어 붙일 방법이 없다. 특히 비동기로 도는 부분이 있으면 로그가 시간순으로 뒤섞여 어느 줄이 어느 요청 것인지 구분이 안 된다. 초당 요청이 스무 건만 되어도 화면에는 스무 요청의 로그가 번갈아 흐른다.
트레이스가 하는 일이 정확히 그 이어 붙이기다. 셋의 관계를 한 줄로 적으면 이렇다 — 메트릭이 「느려졌다」를 알려 주고, 트레이스가 「여기서 느려졌다」로 좁히고, 로그가 「이 입력이었다」를 보여 준다. 셋 중 하나로 나머지를 대신할 수 없고, 셋의 보관 정책도 자연히 갈린다. 메트릭은 가벼워서 몇 년을 둬도 되고, 로그는 가장 무겁고 가장 민감해서 가장 짧게 둔다.
스팬의 경계
스팬의 단위
스팬을 너무 잘게 쪼개면 저장 비용과 화면의 소음이 늘고, 너무 굵게 잡으면 원인이 안 좁혀진다. 실용적인 기준은 하나다 — 밖으로 나가는 호출과 시간이 걸리는 계산에 각각 스팬을 준다.
| 스팬으로 만든다 | 만들지 않는다 |
|---|---|
| 모델 호출 한 건 | 문자열 포매팅, 딕셔너리 조립 |
| 벡터 검색, 리랭킹, DB 조회 | 리스트 슬라이싱 같은 순수 계산 |
| 툴·외부 API 실행 한 건 | 로깅 자체 |
| 가드레일·검증 단계 | 설정 읽기 |
| 재시도 한 번 한 번 | 재시도 전체를 뭉뚱그린 하나 |
왼쪽 줄들의 공통점은 시간이 우리 손 밖에서 정해진다는 것이다. 모델 API가 얼마나 걸릴지, 벡터 DB가 얼마나 걸릴지는 우리 코드가 정하지 않으므로 재 봐야 안다. 오른쪽은 반대로 마이크로초 단위이거나 결정적이라, 스팬을 만들면 얻는 정보 없이 저장량만 늘린다. 참고로 가드레일은 입력이나 출력이 금지된 내용을 담고 있는지 검사해 걸러 내는 단계인데, 자체 모델을 부르는 구현이라면 그 자체가 수백 밀리초를 쓰기도 해서 왼쪽에 둔다.
재시도와 폴백
표의 마지막 줄이 실무에서 가장 자주 놓치는 지점이다. 재시도를 부모 스팬 하나로 감싸 두면 화면에는 「모델 호출 4.2초」로 보인다. 여기까지 보고 나면 결론은 하나뿐이다 — 모델이 느리다.
그런데 그 4.2초가 1.4초짜리 호출 세 번일 수도 있다. 두 번은 429나 5xx로 실패했고 세 번째가 성공한 것이다. 이 경우 고칠 것은 모델도 프롬프트도 아니고 속도 제한이나 동시성 설정이다. 두 상황은 겉으로 똑같이 4.2초이고, 재시도마다 스팬을 따로 열어야 지연의 원인이 모델이 느려서인지 계속 실패해서인지가 갈린다.
같은 이야기가 폴백에도 적용된다. 1차 모델이 실패해 2차 모델로 넘어갔는데 그 전환이 스팬 하나에 뭉쳐 있으면, 대시보드의 모델별 지연 통계가 조용히 오염된다. 실패한 1차 호출의 시간까지 2차 모델 앞에 달리기 때문이다.
RAG 파이프라인의 계층
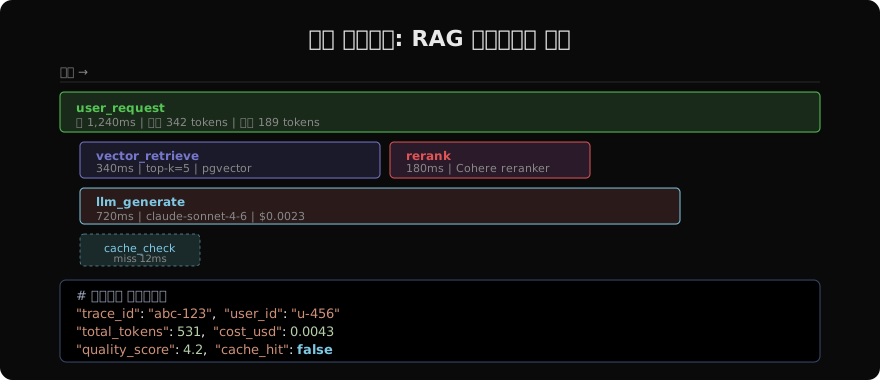
계층을 실제로 어떻게 여는지 보자. 루트 스팬 하나를 열고 그 안에서 자식 스팬을 여는 것이 전부다. 대부분의 SDK가 파이썬의 with 문에 맞춰 두어서, 블록을 벗어나면 스팬이 알아서 닫히고 그 사이가 소요 시간이 된다.
from opentelemetry import trace

tracer = trace.get_tracer("rag")

def answer_question(question: str) -> str:
    with tracer.start_as_current_span("user_request") as root:
        root.set_attribute("app.user_id", current_user_id())
        root.set_attribute("app.prompt_version", "answer_v7")

        with tracer.start_as_current_span("vector_retrieve") as span:
            span.set_attribute("app.top_k", 5)
            span.set_attribute("app.backend", "pgvector")
            chunks = vector_db.search(question, k=5)

        with tracer.start_as_current_span("rerank"):
            ranked = reranker.rerank(question, chunks)

        return generate_answer(question, "\n\n".join(ranked[:3]))
generate_answer 안에서 다시 스팬을 열면 그것도 자동으로 user_request의 자식이 된다. 부모를 인자로 넘기지 않아도 되는 이유는 현재 스팬이 실행 문맥에 담겨 있기 때문이고, 뒤에서 볼 「문맥 전파」가 전부 이 문맥이 넘어가지 못한 경계 이야기다.
with 문을 직접 쓰는 대신 함수에 데코레이터 한 줄을 붙이면 스팬을 열어 주는 SDK들도 있다. 손이 덜 가지만 함수 경계와 스팬 경계가 같아지므로, 한 함수 안에서 모델을 두 번 부르는 자리는 결국 손으로 쪼개야 한다.
그림의 트레이스를 읽어 보면 계층이 왜 필요한지가 한 번 더 드러난다. 총 1,240 ms 중 llm_generate가 720 ms로 58%를 쓰고, vector_retrieve가 340 ms, rerank가 180 ms, 캐시 조회가 12 ms다. 그리고 그 캐시 조회는 miss로 끝났다. 이 한 줄이 있고 없고가 크다 — 캐시 히트율이 낮다는 것을 대시보드의 집계가 아니라 개별 요청에서 확인할 수 있고, 무엇이 빗나갔는지를 같은 트레이스의 입력에서 바로 볼 수 있다.
스팬 속성
속성과 접두사
스팬은 시간만 재는 물건이 아니다. 속성(attribute)이라는 키-값 쌍을 붙일 수 있고, 실제 디버깅 값어치의 절반은 여기서 나온다. LLM 호출 스팬이라면 이 정도는 남긴다.
with tracer.start_as_current_span("llm.generate") as span:
    span.set_attribute("llm.model", "claude-sonnet-4-6")
    span.set_attribute("llm.temperature", 0.2)
    span.set_attribute("app.prompt_version", "answer_v7")
    span.set_attribute("app.retrieved_doc_ids", ",".join(doc_ids))

    response = client.messages.create(...)

    usage = response.usage
    span.set_attribute("llm.input_tokens", usage.input_tokens)
    span.set_attribute("llm.output_tokens", usage.output_tokens)
    span.set_attribute("llm.cache_read_tokens", usage.cache_read_input_tokens)
    span.set_attribute("llm.stop_reason", response.stop_reason)
이름 앞에 llm.이나 app. 같은 접두사를 붙여 두는 것은 취향이 아니라 실용이다. 검색 화면에서 속성이 수십 개로 늘어나면 접두사가 곧 분류가 되고, 나중에 저장소를 옮기거나 표준 규약에 맞춰 이름을 바꿀 때 대상 범위가 명확해진다.
속성의 쓸모
이 중 몇 개는 왜 있는지가 바로 안 보일 수 있어 짚어 둔다.
프롬프트 버전이 가장 값어치가 높다. 프롬프트를 고친 뒤 품질이 나빠졌을 때, 이 속성이 없으면 「언제부터 나빠졌나」를 배포 로그와 대조해 손으로 맞춰야 한다. 배포가 하루에 여러 번 나가는 팀이라면 그 대조가 실질적으로 불가능하다. 있으면 버전별로 잘라 비교하면 끝이고, 나쁜 쪽 트레이스만 골라 입력을 훑는 것도 몇 초다.
캐시로 읽은 토큰 수는 비용 분석의 핵심이다. 프롬프트 캐싱은 반복되는 프롬프트 앞부분을 서버 쪽에 재워 두고 다음 요청에서 훨씬 싼 값에 재사용하는 기능인데, 켜 두고도 실제로 히트하는지 확인하지 않는 경우가 흔하다. 프롬프트 앞부분에 현재 시각이나 요청 ID가 한 줄 끼어 있으면 그 뒤 전부가 캐시에서 빗나간다. 이 값이 계속 0이면 정확히 그 상황이고, 스팬 속성으로 남겨 두면 배포 직후에 바로 알아챈다.
중단 이유(stop reason)는 품질 문제의 조용한 원인이다. 최대 토큰 한도에 걸려 답이 잘린 것과 모델이 스스로 끝낸 것은 사용자 눈에 둘 다 「답이 이상하다」로 보인다. 앞의 경우라면 고칠 것은 프롬프트가 아니라 max_tokens 하나다.
검색해 온 문서 ID는 RAG에서 답이 틀렸을 때 모델 탓인지 검색 탓인지를 가른다. 엉뚱한 문서를 물어다 줬으면 프롬프트를 아무리 고쳐도 안 낫는다. 반대로 맞는 문서가 들어갔는데 답이 틀렸다면 그때부터가 프롬프트 문제다. 이 한 줄이 없으면 두 경우를 구분하지 못한 채 양쪽을 번갈아 만지게 된다.
오류 기록
그리고 오류는 반드시 스팬에 기록한다. 예외를 잡아서 기본값을 돌려주고 지나가는 코드가 있으면 그 실패는 어디에도 안 남는다.
이게 실제로 어떻게 보이는지가 문제다. 리랭커 호출이 타임아웃 나면 예외를 삼키고 원래 순서를 그대로 쓰도록 짜 둔 코드가 있다고 하자. 서비스는 계속 돌고, HTTP 응답은 200이고, 에러율 대시보드는 0%다. 다만 답변 품질이 조용히 나빠진다. 스팬 상태를 오류로 표시하고 예외를 붙여 두면 「성공한 요청 안에 숨어 있던 실패」가 드러난다.
이런 자리를 찾는 방법이 하나 있다. 코드베이스에서 except로 잡고 기본값을 돌려주는 지점을 세어 보고, 그중 스팬에 아무것도 남기지 않는 것을 표시한다. LLM 애플리케이션은 외부 호출이 많아 이런 자리가 생각보다 많고, 대개 하나씩은 실제로 발화 중이다.
본문 보관과 표본 추출
본문 보관 정책
여기가 판단이 갈리는 자리다. 프롬프트 전문과 응답 전문이 있으면 디버깅이 압도적으로 쉽다. 동시에 그것은 사용자가 입력한 내용 전부이기도 하다.
세 가지를 나눠 정하는 편이 깔끔하다.
- 무엇을 남기는가 — 전문을 남길지, 앞뒤 일부만 남길지, 해시만 남길지. 사내 도구와 고객 데이터를 다루는 서비스는 답이 다르다
- 어디에 남기는가 — 스팬 속성에 넣으면 트레이스 저장소가 통째로 개인정보 저장소가 된다. 본문은 접근 권한이 따로 걸린 곳에 두고 스팬에는 참조 키만 두는 구성이 안전하다
- 얼마나 오래 두는가 — 트레이스 메타데이터는 몇 달을 둬도 가볍지만 본문은 다르다. 본문만 보관 기간을 짧게 잡는다
두 번째가 특히 중요한 이유는 접근 범위 때문이다. 트레이스 화면은 보통 개발자 전원에게 열려 있다. 지연을 보려고 여는 화면이 곧 사용자 대화 열람 화면이 되면, 권한 설계를 다시 하기 전까지는 아무도 그 사실을 눈치채지 못한다.
그리고 남기기로 했다면 저장 직전에 마스킹을 건다. 이메일·전화번호·주민등록번호 형태를 정규식으로 걸러 별표로 바꾸는 정도라도 없는 것보다 훨씬 낫다. 여기서 「저장 직전」이라는 말이 핵심이다. 사후에 지우는 것은 훨씬 어렵다 — 이미 인덱싱됐고 백업에도 들어가 있고, 캐시된 화면에도 남아 있다.
무작위 샘플링
트래픽이 조금만 늘어도 모든 요청의 트레이스를 저장하는 것은 비용이 안 맞는다. 그래서 샘플링(sampling)을 건다 — 일부만 골라 남기는 것이다. 다만 LLM 애플리케이션에서 무작위 1%는 나쁜 선택이다. 정작 보고 싶은 것들이 전부 소수라서다.
숫자로 보면 분명하다. 하루 10만 요청이 들어오고 오류율이 0.5%라면 오류가 500건이다. 여기에 무작위 1% 샘플링을 걸면 남는 오류 트레이스는 5건이다. 어떤 사용자가 「어제 오후에 이상했다」고 신고했을 때 그 요청이 남아 있을 확률도 1%다. 백 번 중 아흔아홉 번은 「기록이 없다」고 답하게 된다.
반대로 정상 응답은 99,500건 중 995건이 남는다. 서로 거의 똑같은 성공 트레이스 천 건을 저장하고, 정작 필요한 것은 잃는 셈이다.
표본 추출 규칙
쓸 만한 방식은 요청이 끝난 뒤에 남길지 정하는 것이다. 스팬을 일단 메모리에 모아 두고, 트레이스가 끝나는 시점에 규칙을 적용한다. 시작 시점에는 이 요청이 느릴지 실패할지 알 수 없지만, 끝난 뒤에는 알 수 있다.
- 오류가 난 트레이스는 전부 남긴다
- 느린 트레이스는 전부 남긴다 — p95를 넘는 것들
- 가드레일에 걸렸거나 사용자가 부정 피드백을 준 트레이스는 전부 남긴다
- 나머지 정상 트레이스는 1~5%만 남긴다 — 평상시가 어떤 모습인지를 아는 데는 이 정도면 충분하다
같은 하루 10만 요청에 이 규칙을 걸면 어떻게 되는지 세어 보자. 오류 500건, p95를 넘는 느린 요청 5,000건, 그리고 남은 정상 요청 약 94,500건의 2%인 1,890건이다. 합쳐서 약 7,400건, 전체의 7.4%다. 저장량은 십분의 일 아래로 줄었는데 실제로 볼 가치가 있는 것은 거의 다 남았다. 무작위 1%와 비교하면 저장량은 일곱 배지만 오류 트레이스는 5건에서 500건으로 백 배다.
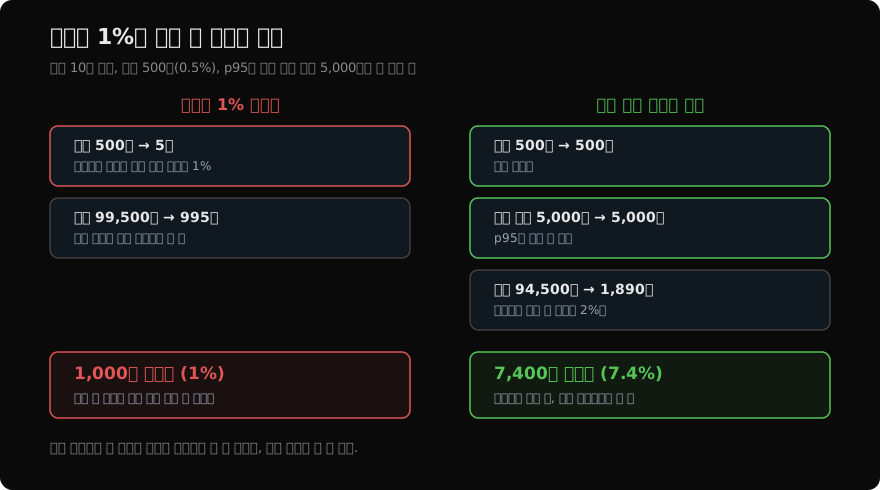
정상 응답을 일부라도 남기는 이유는 비교 대상이 필요해서다. 이상한 것만 모아 두면 그게 정말 이상한지 판단할 기준이 없다. 「이 요청은 벡터 검색이 400 ms 걸렸다」는 사실은 평소가 180 ms라는 것을 알 때만 뜻이 생긴다.
문맥 전파
비동기 경계
트레이싱을 붙였는데 트레이스가 조각조각 나 있는 경우가 있다. 화면에 스팬 하나짜리 트레이스가 잔뜩 뜨고, 정작 보고 싶은 계층은 어디에도 없다. 원인은 거의 언제나 문맥이 전달되지 않은 경계다.
가장 흔한 곳이 비동기 작업이다. 요청을 받아 큐에 넣고 워커가 처리하는 구조라면, 트레이스 ID를 메시지에 실어 보내고 워커가 그것을 부모로 삼아 스팬을 열어야 한다. 안 그러면 워커 쪽이 별개의 트레이스로 뜬다. 스레드 풀에 작업을 던지는 경우, 프로세스를 나누는 경우도 같은 사정이다. 공통점은 코드가 다른 실행 흐름으로 넘어가면서 현재 스팬을 담고 있던 문맥이 따라가지 않는다는 것이다.
증상으로 알아채는 법이 있다. 루트가 아닌데 부모가 없는 스팬, 그리고 자식이 하나도 없는 짧은 루트 스팬이 무더기로 보이면 어딘가에서 문맥이 끊긴 것이다.
서비스 경계와 헤더
서비스가 여러 개로 나뉘어 있으면 HTTP 헤더로 문맥을 넘긴다. 표준이 정해져 있다 — W3C Trace Context가 traceparent라는 헤더 하나에 트레이스 ID와 부모 스팬 ID를 담기로 정해 두었고, 계측 라이브러리들이 대개 이 헤더를 알아서 붙이고 받는 쪽에서 알아서 읽는다.
문제는 자동으로 안 되는 자리다. 직접 만든 HTTP 클라이언트, 내부 RPC, 게이트웨이가 헤더를 지우고 넘기는 설정 같은 것들이다. 마지막 경우가 특히 성가시다 — 코드는 다 맞는데 프록시가 알 수 없는 헤더를 떨궈서 끊기는 것이라, 애플리케이션 쪽만 보면 영영 못 찾는다. 서비스 경계에서 트레이스가 끊기면 코드보다 먼저 중간 계층의 헤더 정책을 본다.
스트리밍 스팬
그리고 스트리밍 응답에서 스팬을 언제 닫느냐가 LLM 특유의 함정이다.
스트리밍은 응답을 다 만들 때까지 기다리지 않고 토큰이 생기는 대로 흘려보내는 방식이다. 그래서 코드 모양이 「호출하고 결과를 받는다」가 아니라 「호출하고 반복자를 돌린다」가 되는데, 여기서 첫 토큰이 왔을 때 스팬을 닫아 버리는 실수가 나온다. 그러면 「200 ms」라는 예쁘고 무의미한 값이 남는다. 대시보드의 지연은 좋아 보이는데 사용자는 느리다고 하는 상황이 이렇게 생긴다.
스팬은 스트림이 끝날 때 닫되, 첫 토큰까지 걸린 시간을 속성으로 따로 남긴다. 사용자 체감은 첫 토큰이 정하고, 비용과 서버 부하는 마지막 토큰이 정하기 때문이다. 두 값을 한 스팬에 나란히 두면 「첫 토큰은 빨라졌는데 전체는 느려졌다」 같은 변화도 그대로 읽힌다. 하나만 남기면 그 변화가 보이지 않는다.
지표와 대시보드
관측성 스택
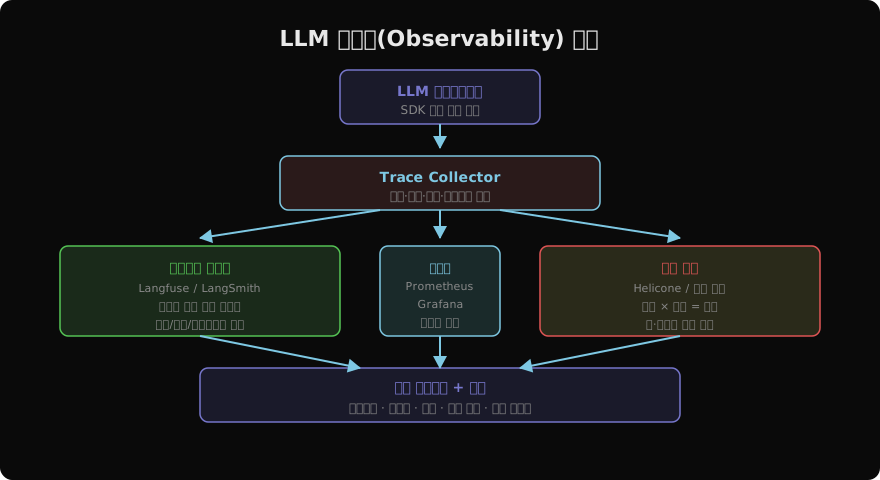
지금까지가 요청 한 건을 들여다보는 이야기였다면, 이제 그것들을 모아 놓고 보는 쪽이다. 스택은 세 층으로 쌓인다.
트레이스는 단일 요청의 전체 생애주기를 기록한다. 입력 프롬프트, 검색된 컨텍스트, 모델 호출 결과, 후처리가 하나로 연결된다. Langfuse나 LangSmith 같은 도구가 이 층을 맡고, 화면은 대개 위에서 본 계단 모양 막대다.
메트릭은 레이턴시·에러율·토큰 사용량 같은 수치를 시계열로 집계한다. Prometheus로 모으고 Grafana로 그리는 조합이 흔하다. 트레이스와 겹쳐 보이지만 쓰임이 다르다 — 트레이스는 한 건을 들여다보고 메트릭은 전체 추세를 본다.
비용은 토큰 사용량에 단가를 곱해 요청별·기능별·팀별로 나눈 값이다. 별도의 층으로 세우는 이유는 집계 축이 다르기 때문이다. 지연은 요청 단위로 보지만 비용은 「이번 달 이 기능이 얼마 썼나」로 묻게 되고, 그 질문에 답하려면 요청마다 기능 이름표가 붙어 있어야 한다.
셋의 공통 뿌리는 맨 아래의 계측 코드다. 같은 호출 지점에서 스팬을 열고, 카운터를 올리고, 토큰 수를 기록한다. 그래서 계측을 한 번 제대로 심어 두면 세 층이 같이 서고, 대충 심어 두면 세 층이 같이 비어 있다.
지표 정의
메트릭 쪽은 정의가 짧다. 요청 수, 지연, 토큰, 비용 넷이면 대부분의 질문에 답한다.
from prometheus_client import Counter, Histogram

llm_requests = Counter(
    "llm_requests", "LLM API calls", ["model", "status", "feature"])
llm_latency_seconds = Histogram(
    "llm_latency_seconds", "LLM response time", ["model", "feature"],
    buckets=[0.5, 1, 2, 5, 10, 30])
llm_tokens = Counter(
    "llm_tokens", "Tokens used", ["model", "type"])   # type: input / output
llm_cost_usd = Counter(
    "llm_cost_usd", "LLM cost in USD", ["model", "feature"])
여기서 두 가지가 실제로 중요하다.
첫째는 레이블이다. model·status·feature 셋을 붙여 두면 「어느 기능이 어느 모델에서 얼마나 실패하는가」를 나중에 물을 수 있다. 안 붙여 두면 그 질문을 하는 날 코드를 고치고 배포하고 데이터가 쌓이기를 기다려야 한다. 다만 레이블 값의 가짓수가 곧 시계열 개수라, 사용자 ID처럼 값이 무한한 것을 레이블로 붙이면 저장소가 터진다. 그런 축은 메트릭이 아니라 트레이스 속성에 둔다.
둘째는 버킷이다. 히스토그램은 「0.5초 이하 몇 건, 1초 이하 몇 건」처럼 미리 정한 경계마다 누적 개수를 세는 방식이고, 그 경계가 버킷이다. p99를 계산할 때 실제로 쓰이는 것이 이 경계들이라, 관심 구간에 경계가 없으면 그 구간의 분위수가 뭉개진다. 위 목록은 0.5·1·2·5·10·30초인데, LLM 응답이 대개 1~5초에 몰린다면 그 사이를 더 촘촘히 잡는 편이 낫다.
이름에도 규칙이 하나 있다. prometheus_client는 카운터를 노출할 때 이름 끝에 _total을 붙이고, 히스토그램은 _bucket·_sum·_count 세 종류로 펼친다. 그래서 파이썬 코드에 llm_cost_usd라고 적어도 쿼리에서 찾을 이름은 llm_cost_usd_total이고, 지연의 분위수를 구하려면 llm_latency_seconds가 아니라 llm_latency_seconds_bucket을 봐야 한다. 알림이 조건에 걸리고도 조용한 흔한 원인이 이 이름 불일치다.
비용 계산은 한 곱셈이다. 입력 100만 토큰당 $3, 출력 100만 토큰당 $15인 모델을 쓰고 요청마다 입력 1,200 토큰·출력 300 토큰이 든다면 요청당 $0.0081이다. 하루 10만 요청이면 $810, 시간당 $34 언저리다. 단가는 자주 바뀌므로 표를 코드 한곳에 모아 두고 공식 가격표를 볼 때마다 그 한 곳을 고친다.
대시보드 항목
대시보드에 무엇을 세울지는 결국 「무엇을 보고 무엇을 하겠는가」로 정해진다. 아래 여섯 줄이면 대부분의 아침 점검이 끝난다.
| 지표 | 설명 | 경고 기준 |
|---|---|---|
| P50/P99 레이턴시 | 응답 시간 분포 | P99 > 5초 |
| 에러율 | API 호출 실패 비율 | > 1% |
| 토큰/요청 | 평균 프롬프트 길이 추세 | 갑작스런 증가 |
| 비용/시간 | 시간별 누적 비용 | 예산 대비 비율 |
| 품질 점수 | LLM-as-Judge 평균 | < 3.5/5 |
| 캐시 히트율 | 시맨틱 캐시 효율 | < 20% (개선 여지) |
세 번째 줄이 LLM 특유의 항목이다. 토큰/요청이 어느 날 갑자기 뛰면 대개 프롬프트를 고쳤거나, 검색이 물어 오는 문서 수를 늘렸거나, 대화 기록을 자르는 로직이 빠진 것이다. 셋 다 코드 변경이 원인이라 배포 시각과 겹쳐 보면 바로 잡힌다. 지연과 비용은 그 뒤에 따라 움직이므로, 토큰이 가장 먼저 신호를 준다.
마지막 줄의 시맨틱 캐시는 똑같은 문장이 아니라 뜻이 비슷한 질문까지 같은 답으로 돌려주는 캐시다. 히트율이 20%에 못 미친다면 임계값이 너무 빡빡하거나 캐시할 만한 질문 자체가 적은 것이고, 어느 쪽인지는 시맨틱 캐시에서 따로 다뤘다.
알림과 품질 점수
경고 규칙
대시보드는 사람이 볼 때만 일하고, 사람은 밤에 안 본다. 그래서 규칙 몇 개는 스스로 울려야 한다.
groups:
  - name: llm_alerts
    rules:
      - alert: HighLLMLatency
        expr: histogram_quantile(0.99,
                sum by (le) (rate(llm_latency_seconds_bucket[5m]))) > 10
        for: 5m
        annotations:
          summary: "LLM P99 레이턴시 10초 초과"

      - alert: HighErrorRate
        expr: rate(llm_requests_total{status="error"}[5m])
              / rate(llm_requests_total[5m]) > 0.05
        for: 2m
        annotations:
          summary: "LLM 에러율 5% 초과"

      - alert: CostSpike
        expr: increase(llm_cost_usd_total[1h]) > 50
        annotations:
          summary: "시간당 LLM 비용 $50 초과"
세 규칙의 성격이 서로 다르다는 점을 봐 두면 좋다.
지연과 에러율에는 for 절이 붙어 있다. 조건이 그 시간 동안 계속 참일 때만 울리라는 뜻이고, 없으면 순간적으로 튄 값 하나에 새벽에 전화가 온다. 대신 for를 길게 잡을수록 알아채는 것도 늦어지므로, 에러율은 2분, 지연은 5분처럼 심각도에 맞춰 다르게 준다.
비용에는 for가 없다. 누적값의 증가분을 보는 규칙이라 이미 시간 창이 안에 들어 있기 때문이다. 임계값은 평상시와의 배수로 잡는다 — 앞에서 시간당 $34가 평상시라고 계산했으니 $50은 1.5배 지점이다. 이 배수를 정하지 않고 「$50쯤이면 되겠지」로 적어 두면 트래픽이 늘어난 뒤부터 매일 울린다.
LLM-as-Judge 채점
지연과 비용은 서버가 알아서 잰다. 품질은 아니다. 사용자가 신고하기 전에 알려면 프로덕션 응답 일부를 골라 점수를 매겨야 한다.
LLM-as-Judge는 다른 모델에게 질문과 답을 함께 주고 채점을 시키는 방식이다. 여기에 표본 추출을 걸어 전체의 5%만 채점하면, 하루 10만 요청 기준으로 5,000건이 채점된다. 추세를 보는 데는 충분하고, 채점에 드는 호출은 본 서비스 호출의 5%로 묶인다.
점수는 트레이스에 붙인다. 그래야 낮은 점수가 나왔을 때 그 요청의 검색 결과와 프롬프트 버전을 같은 화면에서 볼 수 있다. 5점 만점으로 받은 값은 0~1로 정규화해 두면 나중에 다른 채점 방식과 섞어 쓰기 편하고, 2점 미만처럼 명백히 나쁜 것만 따로 골라 슬랙 채널로 보낸다. 여기서 채점 이유 문장을 함께 실어 보내는 것이 중요하다 — 점수만 오면 결국 트레이스를 열어 봐야 하고, 그러면 알림을 봐도 아무도 안 움직인다.
주의할 것은 이 점수가 절대 기준이 아니라는 점이다. 채점 모델이나 채점 프롬프트를 바꾸면 점수대가 통째로 이동한다. 그래서 「3.5점 미만이면 나쁘다」보다 「지난주 대비 0.3점 떨어졌다」가 훨씬 믿을 만한 신호이고, 절대 임계값은 채점 설정을 고정해 둔 기간 안에서만 쓴다.
구조화된 로그
마지막 층이 로그다. 비정형 문자열은 나중에 분석할 방법이 없으므로, LLM 관련 이벤트는 처음부터 구조화된 JSON으로 남긴다.
{"event": "llm_call", "model": "claude-sonnet-4-6", "feature": "support_qa",
 "trace_id": "abc-123", "input_tokens": 342, "output_tokens": 189,
 "latency_ms": 720.0, "cost_usd": 0.0039, "cache_hit": false}
한 줄에 담긴 것이 트레이스·메트릭·비용 세 층과 그대로 겹친다는 점을 봐 두자. latency_ms는 메트릭이 집계할 값이고, cost_usd는 비용 층이 볼 값이고, trace_id는 이 줄을 그 요청의 트레이스에 다시 이어 붙이는 열쇠다. 마지막 필드가 있어야 로그에서 찾은 이상한 응답을 클릭 한 번으로 트레이스 화면에서 열 수 있고, 없으면 시각으로 뒤져야 한다.
여기까지 심어 두면 「어제 오후 3시쯤 결제 문의 답변이 이상했다」는 신고에 답할 수 있다. 그 시간대의 낮은 품질 점수를 찾고, 트레이스를 열어 어떤 문서가 들어갔는지 보고, 프롬프트 버전이 그날 아침 바뀐 것을 확인하는 순서다. 관측성이 하는 일이 그것이다.
그리고 이 계측을 심어 두고 나면 대개 다음 질문은 돈 쪽으로 온다. 토큰 수와 기능 이름표가 이미 요청마다 붙어 있으니 청구서를 기능별·팀별로 쪼갤 재료는 다 모인 셈인데, 그 숫자를 실제로 조립하는 방법과 줄일 곳을 어떤 순서로 손대야 하는지는 아직 남아 있다. 다음 글에서 이어 간다.
읽어주셔서 감사합니다. 😊